|
|
Your source of photonics CAD tools | |
|
| ||
FIMMPROPA bi-directional optical propagation tool |
   |
A side-etched silicon SG-DBR Grating3D modelling with FIMMPROP's Rigorous Coupled Mode Theory (RCMT) engineIn this example we used FIMMPROP's RCMT (Rigorous Coupled Mode Theory) algorithm to model gratings based on a buried silicon DBR (distributed Bragg reflector) geometry. We investigated three different types of gratings:
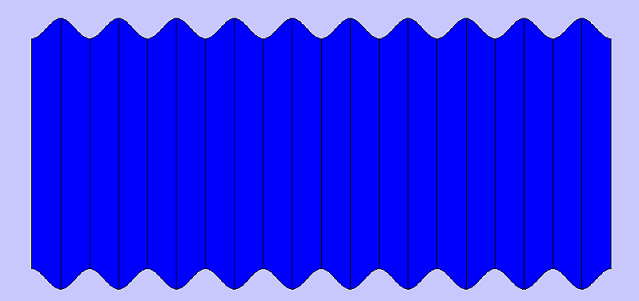
Geometry of the gratingThis grating was adapted from [1]: it is a buried silicon in silica (buried SOI) waveguide with a thickness of 760nm and a width of 1um; this waveguide supports a few modes. In the grating the waveguide is etched by 75nm on each side following a sinusoidal pattern. The grating has a period of 238nm, giving a central wavelength of 1.555um.
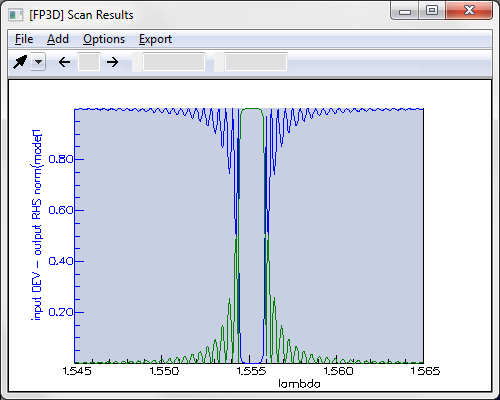
Modelling a single DBR gratingFirst of all we used FIMMPROP to model a single DBR grating. In order to model this structure we used FIMMPROP's RCMT algorithm, which can deal with long gratings with efficiency and accuracy. The RCMT algorithm was able to model the response of a sinusoidal grating with 5000 periods for a single wavelength in 2.4s on a i7-2600 CPU, and we were able to scan the wavelength and the number of periods using the FIMMPROP Scanner. In contrast, modelling such a grating with a standard EME algorithm would have been extremely time consuming, if at all possible. You can find below the transmission and reflection spectra around the central wavelength for 3000 periods, exhibiting a bandwidth of 1.5nm for the peak.
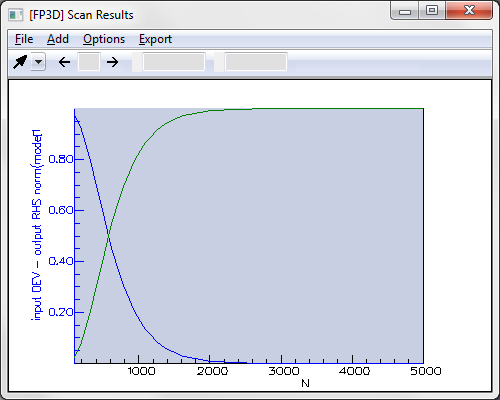
We also used the FIMMPROP Scanner to study the evolution of reflection and transmission at the peak versus the number of periods at the central wavelength of 1.555um. This scan was obtained in just a few seconds.
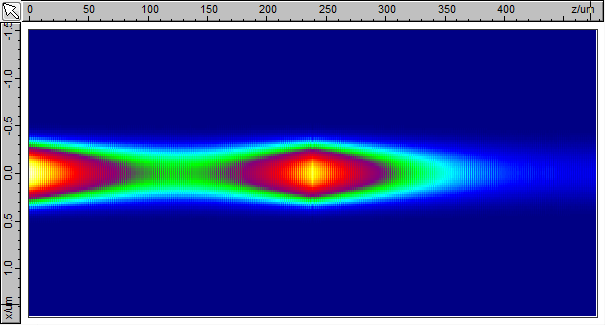
You can see below the intensity profile inside the cavity formed by two DBR gratings with a quarter-wavelength phase shift in the centre; the light is injected from the left-hand side.
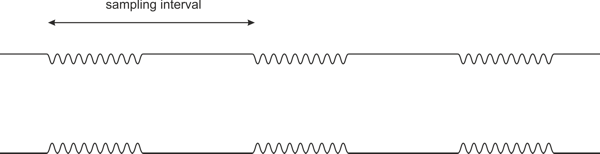
Modelling a sampled DBR gratingHere we are modelling a sampled DBR grating. This grating is created by introducing a pattern of grating bursts followed by lengths of waveguide without grating; this is equivalent to modulating the grating profile with a periodic on/off rectangular function. The resulting spectrum is a convolution of the single grating spectrum over a wavelength comb. The interval between two peaks is controlled by the sampling interval.
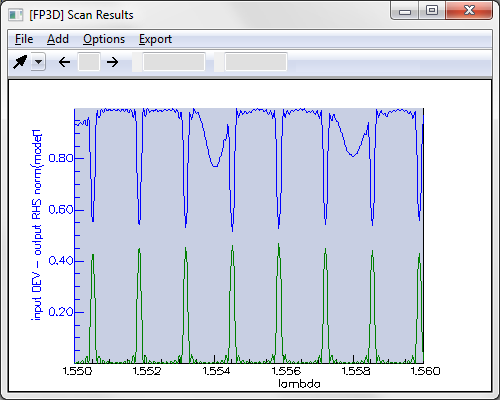
Using the FIMMPROP Scanner, we studied the transmission and reflection spectra of a sampled grating based on the previous design. Each grating burst included 50 periods and the sampling interval was set to 238um (20x the length of a grating burst), giving a peak to peak interval of 1.47nm. Each point in this scan was obtained in a few seconds.
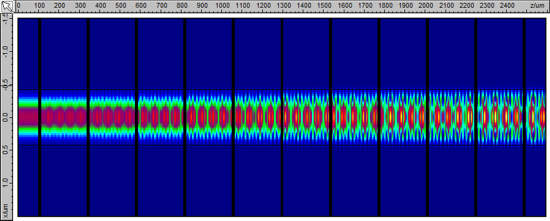
As you can see in the results, the reflection spectrum displays regular peaks as expected, but there are dips in the transmission spectrum. Inspecting the results reveals that these are caused by light being coupled to higher-order modes of the waveguide. This coupling to higher order modes could not have been predicted from a simple grating or an approximate CMT model. You can see below the intensity distribution in the central horizontal plane at 1.554um, corresponding to the first dip in the transmission. The coupling to the higher order mode is clearly visible, with a beating pattern.
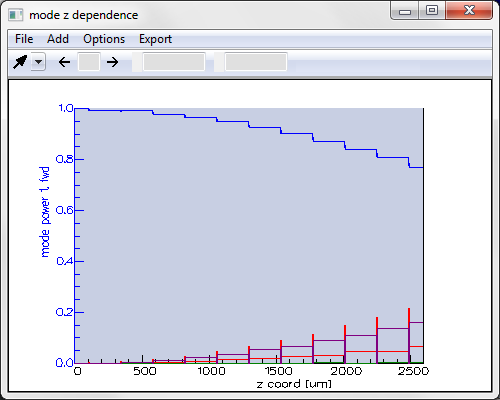
Here you can find the forward-propagating mode power distribution plotted versus z; you can see the amount of light coupled to the higher-order mode increasing at each sample step.
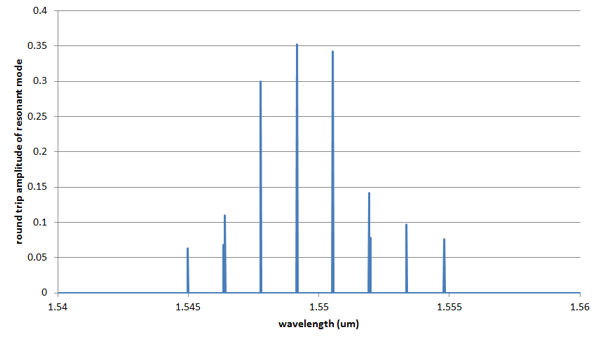
Modelling a sampled DBR grating laser cavityUsing FIMMPROP's script for modelling optical cavities, we studied the resonances associated with a cavity created by two sampled DBR gratings identical to the one above, with a different sampling interval on each side: 20x and 19x the length of the grating burst, respectively; the length of the cavity (the distance between the end of the two gratings) was set to 200um. You can see below the different cavity modes shown versus wavelength; on this plot the resonances appear as peaks, the value of the peak being set to the round-trip amplitude.
References[1] V. Veerasubramanian, G. Beaudin, A. Giguère, B. LeDrogoff, V. Aimez and Andrew G. Kirk, "A Vertical SG-DBR Based Tunable Hybrid Silicon Evanescent Laser", Proceedings of CLEO 2011
|
 © 2023 Photon Design copyright all rights reserved |

 |