PICWaveA photonic IC, laser diode and SOA simulator |
    |
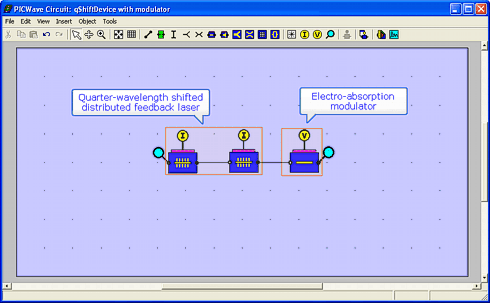
DFB EML - Externally modulated DFB laserSimulation with PICWave softwarePICWave can model semiconductor lasers and their interaction with a photonic integrated circuit. This example shows a quarter-wavelength shifted distributed-feedback laser diode (DFB laser diode) simulated with PICWave. The output of the distributed-feedback laser is modulated on the right-hand side with an electro-absorption modulator.
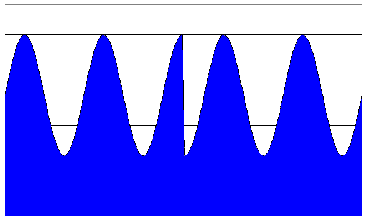
Design of the DFB laser Design of the DFB laserThe distributed-feedback laser consists of two sections whose sinusoidal grating profiles are offset by 180 degrees. This is equivalent to introducing a quarter-wavelength optical phase shift in the middle of the DFB laser. The DFB laser has a total length of 320um. The K coupling coefficient is set to 0.008um-1 leading to a K.L product of 2.56. For a value such as this, the longitudinal mode intensity profile should peak at the location of the phase shift.
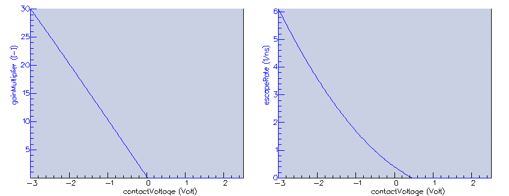
The electro-absorption modulator is driven by a NRZ voltage signal. For the electro-absorption modulator, PICWave allows you to define the escape rate and the absorption (negative gain) as a function of the applied voltage.
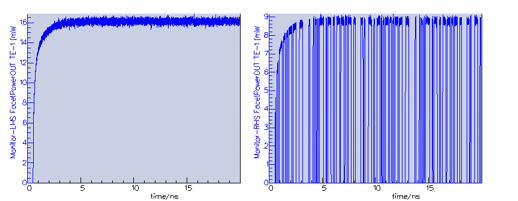
Simulation of the modulated DFB laser in the time-domainThe simulation is run in the time-domain. You can see below the un-modulated output of the laser emitted on the left-hand side and the modulated output on the right-hand side. The overall shape is the same as the one emitted from the left-hand side, but the signal has been modulated by the NRZ voltage drive.
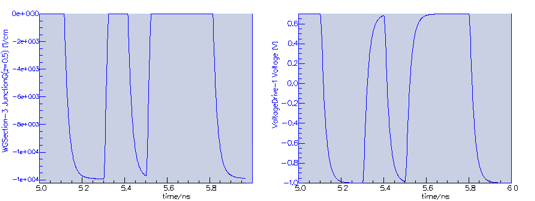
PICWave allows you to plot the absorption in the modulator, shown here along with the voltage drive. Plotted over a smaller time scale, it allows you to see how the voltage signal drives the absorption.
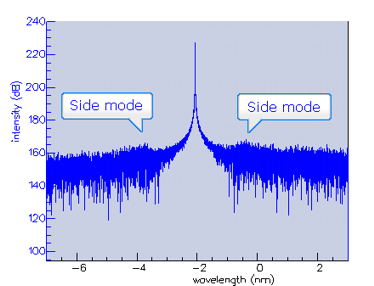
The spectrum of the laser output is shown below around the central wavelength. You can see that the side modes are strongly attenuated, and that the laser emits as expected at a single frequency.
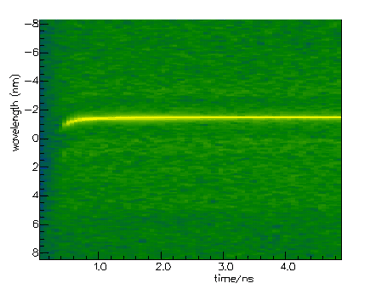
Time-evolving spectra can also be plotted.
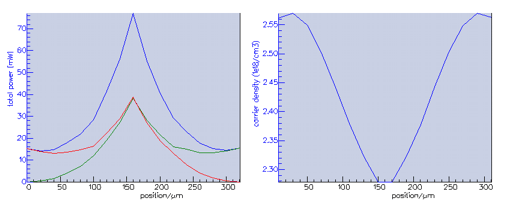
Longitudinal hole burningPlotting the mode power along the axis of the DFB laser shows a strong intensity peak at the location of the phase shift. Plotting the carrier density against z shows how the intensity peak causes longitudinal hole burning with a dip in the carrier density. This behaviour is expected given the value of the K.L product and the position of the phase shift at the centre of the DFB laser.
|

